Dashboard
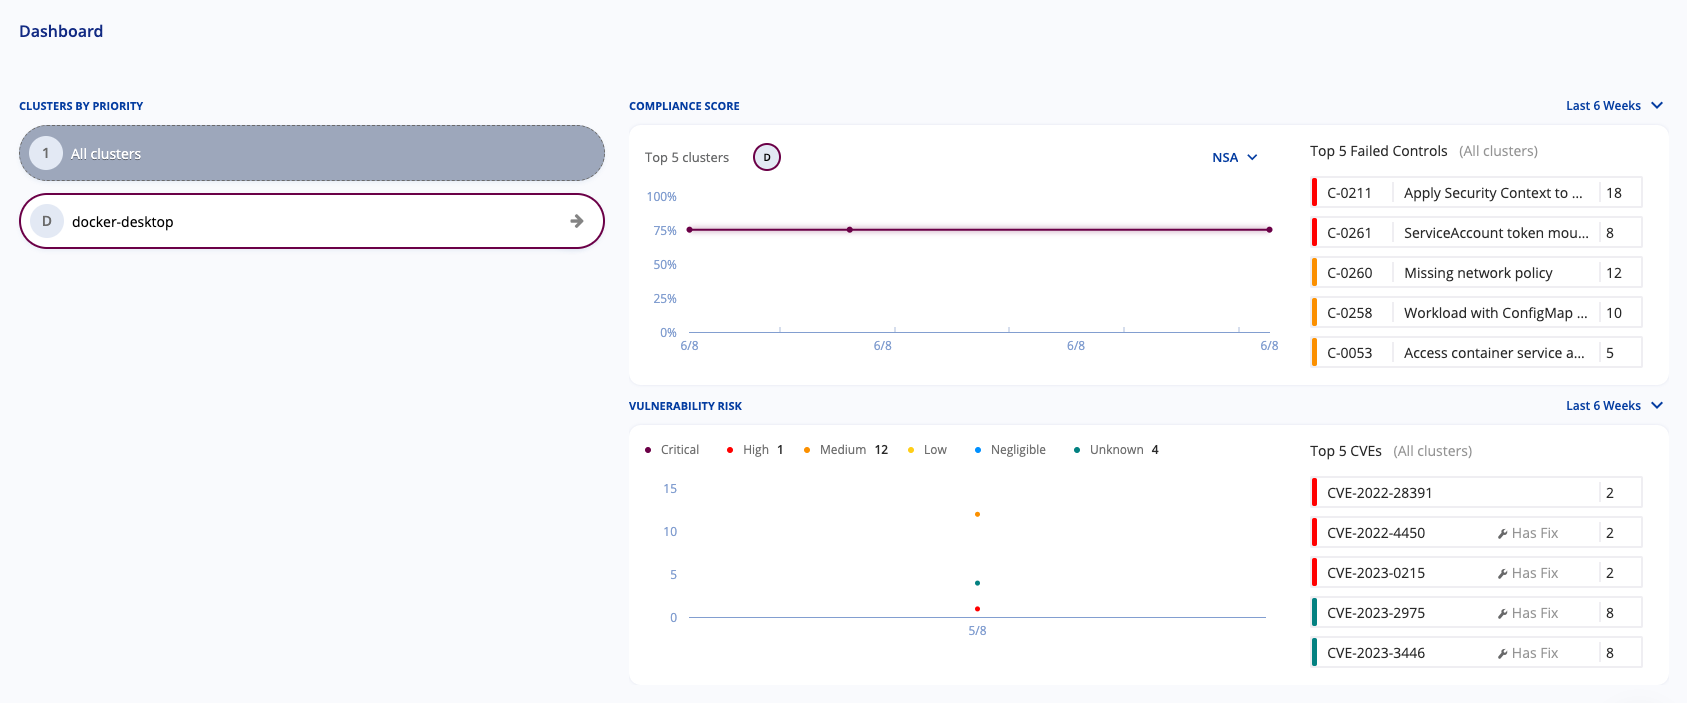
The dashboard is the default page and provides an aggregate view of the health and security of the Kubernetes clusters you’ve scanned.
The dashboard focuses on high-priority issues around compliance and security. It shows clusters with the highest risk scores; misconfigurations and vulnerabilities charted over time; the top five failed controls; and the top five vulnerabilities.
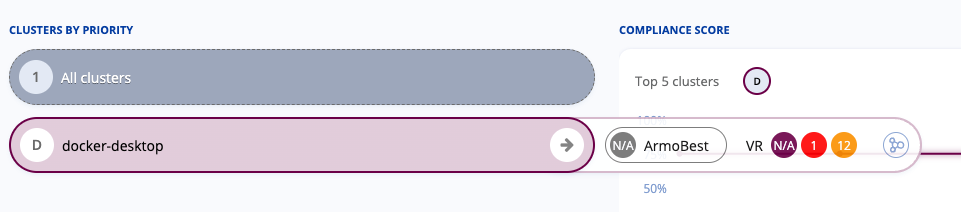
Clusters
Clusters are sorted by risk score, and you can navigate to clusters that aren’t in immediate view by clicking All clusters. When you hover on a cluster, you can see the frameworks it was scanned against, the top priority vulnerabilities, and a link to the RBAC Visualizer.
If you click the cluster name, you open the Compliance section and can view controls that your cluster was tested against.
Compliance Score
The Compliance score shows how compliant your clusters are with selected frameworks over a period of time. It also shows the top five failed controls. You can see trends or identify drift changes in your configurations.
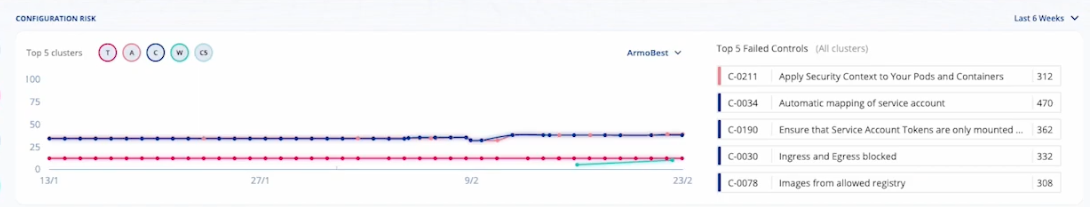
Click a control to view more information about the control, the clusters it’s failing on, and the resources that failed. When you view the failed resources, the Compliance section opens to the failed resources for the control. You can ignore the failed resource if the control is an acceptable risk, or you can view a suggested fix.
Vulnerability Risk
The Vulnerability risk shows the number of identified vulnerabilities in your clusters’ workloads over a period of time and the top five CVEs discovered. You can see trends in your security posture to chart how vulnerable you are to malicious attacks.
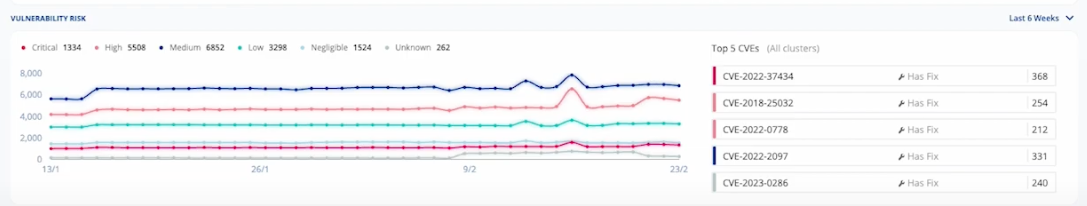
Click a CVE to view more information, such as the workload it was identified on or image tag. The Vulnerabilities section opens to that CVE in the workload.
When you view the CVE, ARMO Platform provides a method to ignore the CVE if it’s an acceptable risk and suggested remediation steps.
Updated 5 months ago